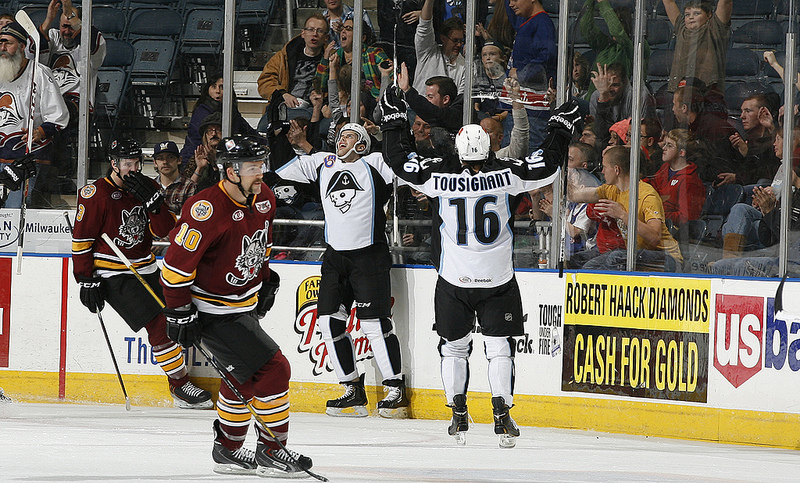
(Photo credit to Scott Paulus)
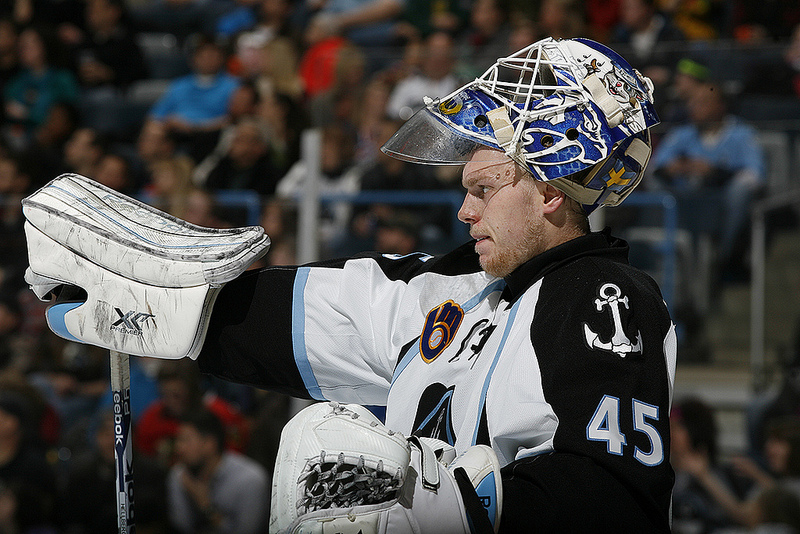
There was so much to be excited about with Magnus Hellberg coming into this year. His rookie season was finished off with brilliant results that helped the Admirals reach the playoffs for the eleventh-straight season. For his efforts, he took part in the Nashville Predators pre-season camp. Sadly for Hellberg he was injured on the first day. He started off his season in Milwaukee and started in net for three games. Then came the Pekka Rinne injury and a call up to the NHL where Hellberg saw 12:12 of ice time in a relief role. He was next swapped by Nashville with the undefeated performer in net for the Admirals, Marek Mazanec, and instantly thrown back into the fire with games on the road with the explosive Texas Stars and pesky San Antonio Rampage.
It seems as if, ever since, he hasn’t played with the consistency and execution he displayed at the end of last year. Have teams figured him out? Is there a nagging injury? Is he a slow starter? Is there a little bit of a mental let down knowing he was in Nashville and then his replacement Mazanec has been, well, Mazanec? To me, it is very difficult to pin it on the roster switch with Mazanec but that is just one of many speculations you could dish out on the matter. Me, I’m a nerd who enjoys looking at statistical breakdowns in cases such as this to find differences or similarities. Let’s take a look at the numbers on Hellberg this year to last year – specifically this year’s first nine starts (which means, you guessed it, all of them to this point) versus last season’s first nine starts.
Magnus Hellberg’s First Nine Starts in 2012-13
10-21-12, @ HOU: W, 17 saves, 4 goals allowed, 0.810 SV%
10-31-12, vs. CHA: W, 27 saves, 4 goals allowed, 0.871 SV%
11-9-12, vs. CHI: ND (pulled), 13 saves, 3 goals allowed, 0.812 SV%
11-24-12, @ CHI: W, 30 saves, 3 goals allowed, 0.909 SV% – 5-6 in shootout saves
12-9-12, @ CHA: W, 26 saves, 2 goals allowed, 0.929 SV%
12-11-12, @ CHA: L, 30 saves, 3 goals allowed, 0.909 SV%
12-15-12, @ PEO: L, 34 saves, 2 goals allowed, 0.944 SV%
12-19-12, vs. RFD: L (pulled), 11 saves, 3 goals allowed, 0.786 SV%
12-29-12, @ RFD: L, 36 saves, 3 goals allowed, 0.923 SV%
Magnus Hellberg’s First Nine Starts in 2013-14
10-11-13, @ ABB: L, 28 saves, 3 goals allowed, 0.903 SV%
10-12-13, @ ABB: W, 26 saves, 1 goal allowed, 0.963 SV% – 4-4 in shootout saves
10-19-13, vs. CHI: L, 19 saves, 3 goals allowed, 0.864 SV%
11-8-13, @ TEX: L (pulled), 33 saves, 6 goals allowed, 0.846 SV%
11-10-13, @ SA: L, 43 saves, 2 goals allowed, 0.956 SV% – 4-5 in shootout saves
11-13-13, vs. GR: W, 28 saves, 1 goal allowed, 0.966 SV%
11-15-13, vs. CHI: L, 22 saves, 3 goals allowed, 0.880 SV%
11-19-13, vs. ABB: L, 33 saves, 4 goals allowed, 0.892 SV%
11-20-13, @ GR: L (pulled), 35 saves, 4 goals allowed, 0.897 SV %
The Sum
2012-13 Season
4-4-0-0 record, 224 saves, 27 goals allowed, 0.892 SV%
Goal Support in Games Started: 30
2013-14 Season
2-2-3-1 record, 267 saves, 27 goals allowed, 0.908 SV%
Goal Support in Games Started: 20
The way I see it by the numbers Hellberg is simply facing more this year with far less offensive production in front of him. He’s actually doing better than he was his rookie season as far as saves and save percentage is concerned. It’s only the win column where things don’t match up and the goal support the Admirals provide when he starts. So, is this a slow start for Hellberg? Actually not. He’s provided the Admirals a much needed stopper in goal. Just like any goalie though there are only so many shots that can get poured in before an offense breaks through. That’s happening at the same rate, 27 goals allowed through nine starts, as last season with a better save percentage.
Long story short (too late), the Admirals offense and defense need to step up their games to relieve some of the pressure being forced upon their netminder. It’s a dangerous game to play the way the Ads have this season. As a whole they have been outshot by their opponents 386-349 this season and it’s what both sides do with those shots that make the big dent. The Ads are seventeenth in the AHL in goals scored. They faced the top two teams in the AHL in goals scored on back-to-back nights this week and were outshot 80-56 in those games. That’s asking for trouble. For the Ads to see an improvement from their recent run of games all that’s required is to relieve stress on their own net by putting some shots on goal at the other end. To boot, the Ads need to sharpen up their finishing rate because 44 goals scored from 349 shots just isn’t good enough to hang with teams such as the Heat or Griffins.